Weather vs. Climate
VIPs
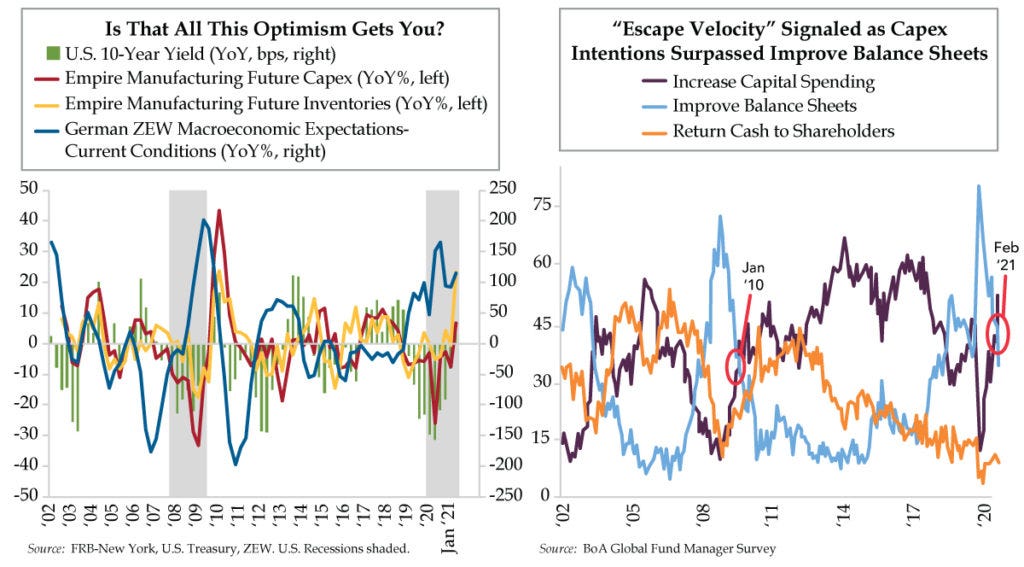
Per the New York Fed’s Empire Manufacturing survey, Future Inventories expanded rapidly in February, posting a 1.85 when normalized as a z-score; Future Capex also advanced to pre-COVID levels for the first time, jumped to 28.6 points to register a 0.85 z-score reading
The Expectations-Current Conditions spread in the German economy hit 138.4 in February, just below Q3 2020 highs, per the Centre for European Economic Research; the 114-point annual gain in the spread reflects a turnaround in German hopes for recovery
In Bank of America’s latest Fund Manager Survey, 51% of CIOs wanted CEOs to increase capex, with calls for balance sheet improvements falling to 33%; despite the escape velocity narrative, a sustained healing in corporate earnings is still needed to confirm the optimism
You know the small talk has fizzled when you need weather for a fall back. And then there’s the deep freeze from the U.S. Northern Plains through its southern border, a meteorological event with no precedent. Still, the weather is not the same as the climate, at least according to the National Oceanic and Atmospheric Administration (NOAA). To distinguish between the two, NOAA cleverly explains that, “Weather tells you what to wear each day. Climate tells you what types of clothes to have in your closet.” As for the scientific approach, experts study trends in precipitation, temperature, humidity, sunshine and wind over decades or longer depending on the locale.
Economics lends itself to the weather vs. climate analogy. Investment cycles are drawn with higher frequency ebbs and flows, and lower frequency longer range projects. As we’ve expounded of late, in a post-pandemic world that defies historical patterns, one fitting adaptation is how the inventory cycle compares to that of capital expenditures (capex). The former oscillates around short-run imbalances between demand and supply. When demand dips, supply falls back like a roller coaster going downhill; the opposite force is exerted when demand perks back up. A more durable economic recovery manifests in confidence-catalyzed capex cycles.
The New York Fed’s Empire Manufacturing survey provides some of the first clues as to where manufacturers reside on the conviction spectrum. Yesterday’s February installment revealed Future Inventories continued expansion at a historically rapid clip (+14.9 vs. 0.0 long-run average for a 1.85 z-score, deviation from mean adjusted for volatility). Future Capex also advanced to pre-COVID levels for the first time since the pandemic unfolded last year (+28.6 vs. 19.8 long-run average for a 0.85 z-score).
Before you get all bulled up, note that relative to the other Fed surveys, Empire covers the smallest industrial footprint. Activity in the nation’s chemical hub is revealed in the Philly Fed while Dallas’ survey shines a spotlight on autos, energy and export activity. Nonetheless, the connectivity of the industrial supply chain suggests we not dismiss the Empire’s meteorology.
For timeliness, note that the last two observations in today’s Empire data are January and February, a departure from the chart’s smoother quarterly year-over-year changes. The data suggest the future supply outlook (yellow line) is as optimistic as ever and only compares to the post-Great Recession highs. The forward view for capex, has only tentatively poked its head above water for the first time in three years (red line), not a resoundingly optimistic signal.
You don’t need a history of the trade war, followed by the shock of the coronavirus, to grasp that the supply chain is as nationally interconnected as it is internationally. Germany remains a beacon of clean data on the health of the global factory sector. To that end, the Centre for European Economic Research’s ZEW survey offers a dependable take on optimism, or a lack thereof. In February, the spread between Macroeconomic Expectations (71.2) and Current Conditions (-67.2) expanded to 138.4, just shy of 2020’s third-quarter highs. The 114-point annual gain in the spread (blue line) reflects a turnaround in German investors’ hopes for an economic recovery. ZEW President Achim Wambach was especially heartened given, “export expectations in particular have risen significantly.”
So how’s the weather between Germany and the U.S.? The interconnectedness of the global supply chain allows for comparisons between industrial bellwether Germany’s perceived bullishness being proportionally consistent with the Empire’s future inventory trend. No doubt, many New York manufacturers source product from export-leader Germany. How is it that, one year later, all we’ve got to show for the exuberance both here and there is a 17-basis point rise in the benchmark 10-year Treasury yield (green bars)?
Bank of America’s (BofA) queried investor universe with $614 billion under management have voted for a shift in the climate towards a less cautious capex outlook. Asked what they would most like to see companies do with cash flow -- increase capital spending, improve balance sheets or return cash to shareholders -- February’s Global Fund Manager Surveyrevealed 51% of CIOs wanted CEOs to increase capex; this is the first time in a year we’ve seen the focus shift to organically growing companies. Only 33% called for balance sheet improvements; the nervousness that was acute has dissipated. BofA likened this “escape-velocity” signal to the cyclical turning point also reached in their January 2010 data.
It will require more than one small region of the U.S. or bullish fund managers to convince us that the capex climate is changing. A broader vaccine rollout combined with sustained healing in corporate earnings must validate the narrative. In the interim, a record net one-in-four surveyed by BofA reported that they’re taking higher-than-normal risks; that helps explain why cash levels have fallen to an eight-year low.
Across the Street, as reported by Bloomberg, JP Morgan Chase’s gauge of cross-asset complacency -- including valuations, positioning and price momentum -- rose to a two-decade high. This stands in stark contrast to the scant 13% of BofA’s respondents who said the U.S. stock market was in a bubble; we’re sure there’s no coincidence with their reported exposure to stocks hitting the highest in 20 years. As to that disconnect, to be determined is as good as we can do. There’s nothing like a tightening in financial conditions to convince CEOs they were premature in concluding the climate had shifted after all.