


The Rubberband Man
“Hey ya'll prepare yourself for the rubberband man You've never heard a sound Like the rubberband man You're bound to lose control When the rubberband starts to jam”
Not long ago, music was only delivered through the medium of radio. Today, we say, “Alexa, play ….” On Monday, we filled in that blank with a song by The Spinners. The rhythm and blues group hailed from Ferndale, Michigan, debuted in 1954 and by the 1960s and 1970s enjoyed a string of hit singles and albums. On September 11, 1976, they performed “The Rubberband Man” on ABC’s American Bandstand. By that Thanksgiving, it peaked at number two – for three weeks – on Billboard’s Hot 100 chart. Forty-two years later, it rubber-banded back to popularity care of 2018’s Avengers: Infinity War.
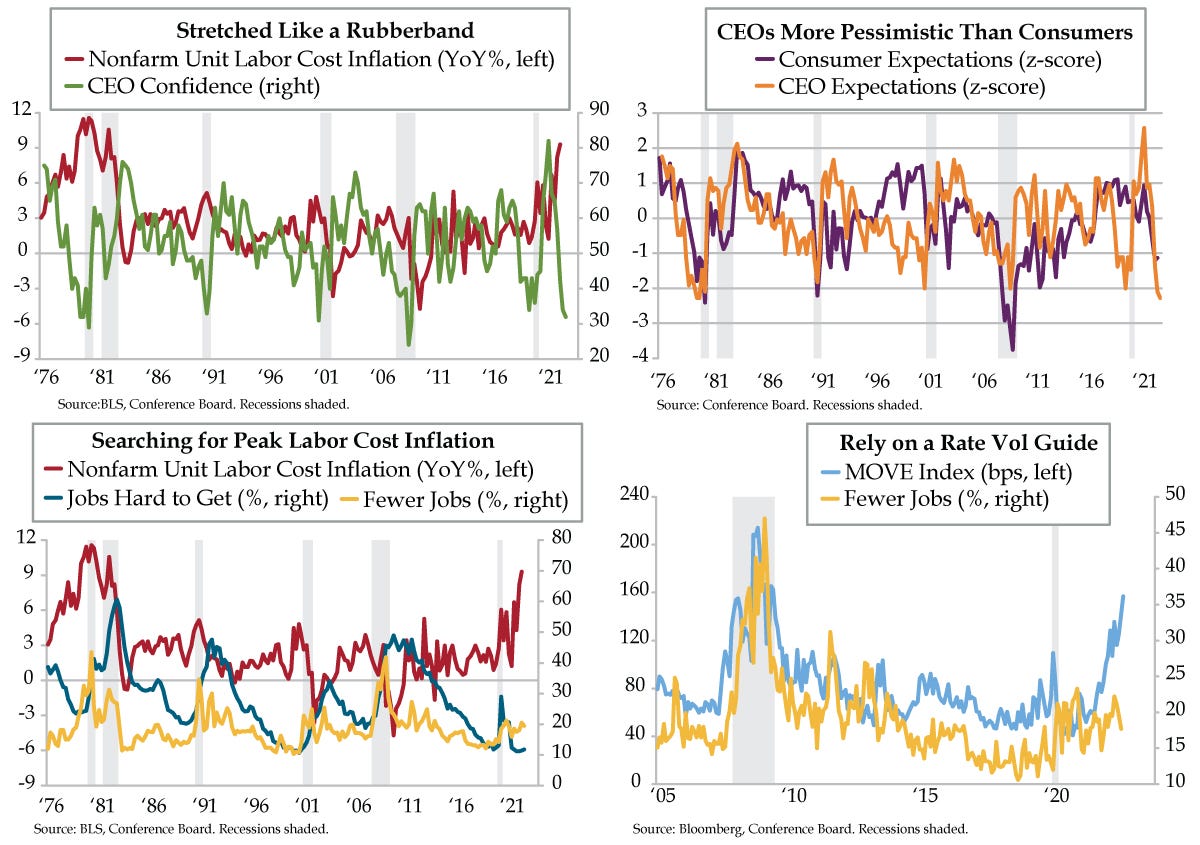
The dry science produces ample data with elastic characteristics. If you were to place the Conference Board’s quarterly CEO confidence on the rubber spectrum, you’d see it’s stretched as taught as ever. In the current quarter, C-suite pessimism fell to 32 on a 50 breakeven basis, the lowest since the Great Recession (green line). Normalizing using z-scores, deviations from the mean adjusted for volatility, produced -2.08, an extreme that flagged recessions in 1980, 1990-91, 2001 and 2007-09. Of the 136 CEOs queried, “an overwhelming majority—98%—said they were preparing for a US recession. Moreover, 99% of CEOs said they were preparing for an EU recession.” They’re wise to be in prep mode. According to S&P Global’s Flash U.S. Composite for October, released yesterday, “New business from abroad fell sharply and at the quickest pace since May 2020.”
The executives who write the recession narrative are painfully attuned to labor being the priciest in 40 years. Nonfarm unit labor cost inflation reached a 9.3% year-over-year rate in 2022’s second quarter, the highest since 1982 (red line). Peak labor costs have historically coincided with a bottoming in CEO confidence.
The Conference Board’s consumer confidence survey complements this discussion. QI is proud to have coined the concept of the Outlook Gap, the spread between forward-looking CEO expectations and consumer expectations. The interplay between the two series contextualizes the current backdrop. CEO expectations (orange line) have tended to deteriorate later in the business cycle and trough before or in tandem with consumer expectations. Consumer expectations (purple line) usually fall through CEO expectations. That juncture is still in front of us.
Another concept engineered by QI, the Labor Curve, juxtaposes the most relevant responses on current employment conditions, i.e., Jobs Hard to Get, and future employment expectations, i.e., Fewer Jobs from consumer confidence. This soft-data labor guide mimics the U.S. Treasury yield curve and has been inverted for a record 17 straight months from May 2021 to September 2022. Jobs Hard to Get is an ideal alternative to the unemployment rate given it sports a .88 correlation to the official data. This said, the Labor Curve is not derived from consumer expectations; it doesn’t feed the convergence of consumer expectations to and through CEO expectations.
To gauge where we’re headed, look to Fewer Jobs, one of QI’s Top 10 gauges of the labor cycle. The Federal Reserve’s tightening cycle aims to lower job openings. The official JOLTS data and higher frequency sources from Burning Glass and Indeed suggest that its policy is succeeding. But labor “paper losses” don’t drag on employment expectations with the same magnitude as layoffs.
The initial October print from S&P Global leaves little doubt job cuts are in train. The seasonally adjusted Employment Index for the composite index fell below the 50-line for the first time since June 2020, “largely driven by a fall in service sector staffing numbers. Meanwhile, manufacturers registered a slower pace of job creation.” The data are finally reflecting the layoff headlines that have peppered the financial media landscape for months.
Compounding pressure on the employment front is shrinking backlogs. Per S&P, unfilled orders contracted economy-wide: “The service sector indicated a renewed fall in the level of outstanding business. Manufacturers, meanwhile, saw work-in-hand contract for the first time in over two years.”
The darkest warning in the data stemmed from the outlook, echoing the universality of dour CEO confidence. Expectations for output across the nation’s factory floors slid to the lowest in nearly 2 ½ years. We’ve heard that machinery that’s been backordered is being cancelled which resonates with the survey’s warning that, “current output is only being maintained by firms eating into backlogs of previously placed orders.” The string of contractions pressing into a fourth month understates S&P’s bottom line that “The resulting degree of confidence was among the lowest in the survey history.”
Interest rate volatility proxies that of the future labor market. Since the start of the Quantitative Easing (QE) era, the MOVE Index of implied Treasury yield volatility (light blue line) has ebbed and flowed with the Fewer Jobs (yellow line). The recent spike in the MOVE has yet to be fully reflected in forward labor guidance.
Rate decompression is another rubber band ready to snap. When it does, the last support for job prospects will collapse. What follows will be consumer expectations slicing through the trough in CEO expectations. Investors can hope this finally compels Powell to tap the brakes. Barring a rapid reversal in the Consumer Price Index, a “tap” is the most that can be anticipated as opposed to a snap back to QE.