

The Oldest Song of Rock and Roll
It may be based in Cleveland, Ohio, but the Rock and Roll Hall of Fame honors music genres across the United States. Curator James Henke was joined by his staff, rock critics and music experts to create an (unordered) list of 500 Songs That Shaped Rock and Roll, which is a permanent exhibit envisioned as part of the museum when it opened in 1995. Astonishingly, the oldest song is “Wabash Cannonball,” written in 1882 and credited to J. A. Roff. The 19th century American folk song describes the scenic beauty and predicaments of a fictional train, the Wabash Cannonball Express, as it traveled on the Great Rock Island Railroad. The song has become a country music staple among marching bands from Indiana State, Purdue, Stephen F. Austin State, Kansas State, Texas Tech, to QI’s University of Texas Longhorns. Hook ‘Em!
Rocking and rolling over the rails also beckons the sensation of goods moving across the U.S. landscape from one destination to the next as upstream inputs deliver to downstream factories. Imported consumer products are carried to warehouses and retailer store shelves. The connectivity defines the inventory cycle which is where the Logistics Managers’ Index (LMI) enters the story. This nascent macroeconomic report is a team effort galvanizing researchers at Arizona State University, Colorado State University, Rochester Institute of Technology, Rutgers University, the University of Nevada – Reno and the Council of Supply Chain Management Professionals (CSCMP).
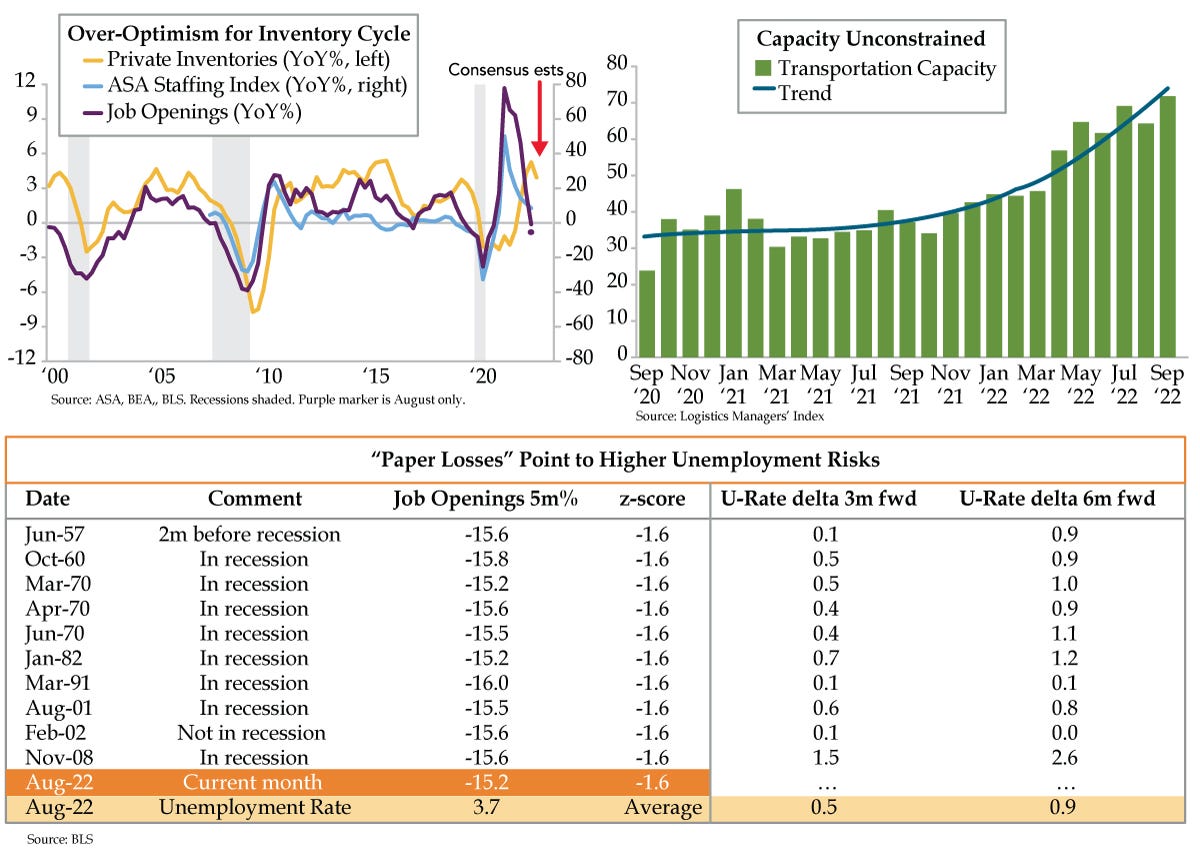
To get things from one place to another, transportation capacity is a must. The September LMI flagged inventory moving at a glacial pace vis-à-vis that of the last two breakneck years. Transportation Capacity rose 7.5 points in September to 71.8 (on a 50 breakeven basis, green bars), the second highest rate in the LMI’s six-year history. Moreover, the headline LMI index sank appreciably from 63.6 to 56.2 from early to late September. This was largely due to big declines in the inventory growth and costs concomitant with a sizable gain in transportation capacity (from 67.7 to 76.9) reflected in a notable decline in transportation prices.
To put this soft data in context, LMI explained: “Delivery companies are projecting to handle approximately 92 million parcels per day during the holiday season. While this is well above the pre-pandemic norm, firms have built up the capacity to handle 110 million packages, meaning that some of this will likely go unused….”
Hard data on inventories, which are lagged relative to other economic indicators, will press economists’ patience. Exacerbating matters, broad measures in GDP are scored over quarterly intervals; there are less frequent updates in the ‘official’ data. Ergo, the second quarter is the “earliest” time stamp over the course of which real private inventories totaled $2.916 trillion (not annualized). September’s Blue Chip Consensus anticipates an additional $59.8 billion and $58.5 billion (at annual rates) will bolster the U.S. economy’s supply side in the third and fourth quarters, respectively. That would push the year-over-year (YoY) trend from 4.2% in the second quarter to 5.2% in the third and 3.9% in the fourth (yellow line).
The forecasting community sees no inventory correction in 2022, a probability to which we assign a value of zero. It’s only when firms are expanding that they pad budgets that fund future investments and grow payrolls. Cost cutting reverses this process. It’s akin to incurring paper, as opposed to realized, economic losses. By the way, planning to curtail existing business and reduce headcount arrests the inventory cycle.
On that note, August job openings put paper losses on the ledger, posting a -1.117-million decline, 1.028 million of which were private sector. Outside the pandemic, both were record absolute declines. Critically, the weakness was widespread across almost every industry and region driving the YoY path into negative territory (-5.4%, purple marker) for the first time in two years, a marked departure through early this year (purple line). Did we mention that job openings lead the inventory cycle? The clock dictates that they shine a light two to three quarters into the future. Outright inventory declines should be manifest by 2023’s first quarter. The leading indicator of temporary employment (light blue line) will help signal the exact timing.
For historical perspective on clues as to this Friday’s payroll report, we linked the JOLTS series with the discontinued Conference Board’s Help Wanted Advertising Index to create a long-term series. The latest five-month decline in job openings (-15.2%) scaled to a -1.6 z-score (deviation from the mean adjusted for volatility) in August. Other -1.6 instances are depicted in the table. All but one happened in or before recession. The upshot: unemployment rises with an average gain of 0.5% three months forward and 0.9% six months hence (table).
Tuesday’s shock job openings data, which the market cheered mightily as proof Powell will pivot anew, suggest the unemployment rate hits 4.2% in November, within a whisper of the Fed’s 2023 year-end forecast of 4.4%. Given November’s employment report is released December 2nd, Fed officials would have all of 12 days to contemplate the unemployment rate shock forcing a pivot prior to December 14th’s FOMC meeting…during the FOMC blackout that begins the day the jobs data are released. It’s one thing to use your media connection to up the ante from a 50-basis-point rate hike to one that’s “unusually large”, a la June 2022. It’s quite another to drive a pivot train into the station via the same (ahem, unorthodox) transmission mechanism.