The Idea Man

Bill Blazejowski: Wanna know why I carry this tape recorder? To tape things. See, I'm an idea man, Chuck. I get ideas coming at me all day. I can't control 'em. I can't even fight 'em if I want to. You know, 'AHHH!' So I say 'em in here, and that way I never forget 'em. You see what I'm sayin'?
[speaking into tape recorder]
Bill Blazejowski: Stand back, this is Bill. Idea to eliminate garbage. Edible paper. You eat it, it's gone! You eat it, it's outta there! No more garbage!
Before Beetlejuice, The Founder and Birdman, Michael Keaton was cast in 1982’s Night Shift by Ron Howard. He played across from Henry Winkler as a fast-talking “idea man” who was always trying to hatch cockamamie schemes to make a quick buck. To our surprise, Rotten Tomatoes ranked Night Shift at 93% on its Tomatometer, second only to 2015’s Spotlight (97%) as Keaton’s best work.
Intellectual property that finds its way onto the silver screen is not the sole preserve of timeliness. At QI, we endeavor to create graphics that also stand the test of time, ones that can be referred to from one cycle to the next. One route to attaining this ‘best in economics class’ is to break down a headline macro indicator into its micro counterparts. The desert, otherwise known as this week’s U.S. economic calendar, has given us license to seek out candidates.
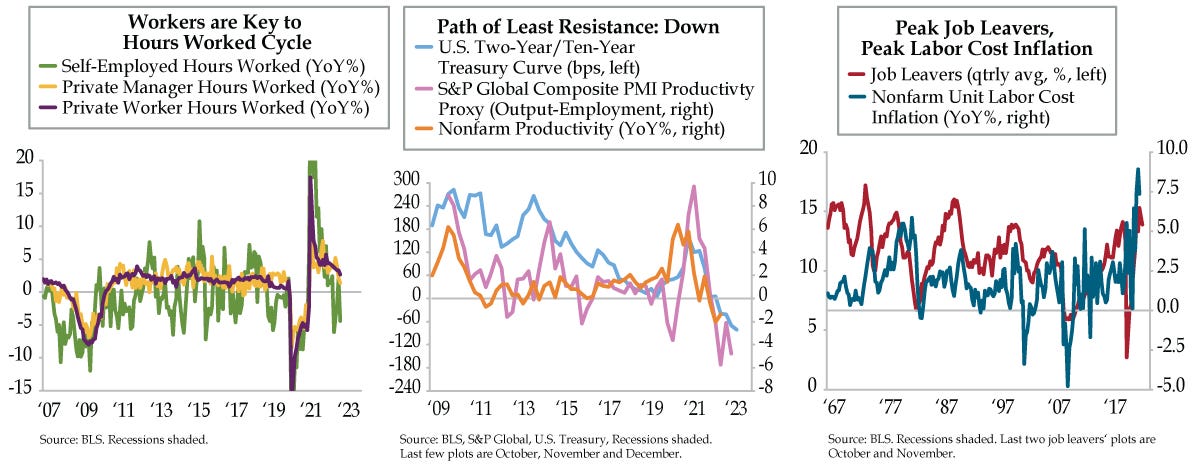
In that spirit, we divided aggregate hours worked three ways – into private workers, private managers and the self-employed. Nonfarm output from the quarterly Productivity and Costs report includes a small input from the self-employed. Most of the trend is driven by the aggregate hours figure from the Establishment Survey. However, these “fringe” workers help identify major cyclical turning points. If we only looked at private worker hours worked, we’d have no quibbles from a business cycle standpoint. So far in the fourth quarter, this metric has decelerated to a 2.7% year-over-year (YoY) rate through November (purple line), a far cry from raising a recession flag.
Leave that up to the two other series. Private manager hours worked expanded at 1.4% (yellow line), about half the YoY pace as workers and shorter run trends registered outright declines in November – the 3-month annualized pace hit -3.7% while that of its 6-month counterpart clocked in at an annualized -1.3%. This set up – the 3-month read south of the 6-month – implies that the 12-month comparison is poised to fall into the red.
Self-employed hours worked (green line) has a higher beta than both worker and manager hours worked. Despite excess noise, the YoY path is instructive when it is contrasted against the other two series. The pandemic aside, because we’re only able to look back to 2007 (manager hours worked start in 2006), we’re limited to one recessionary comparison. With that as backdrop, in the lead-up to the Great Recession, self-employed led the contraction in managers; both led the downturn in workers. While workers are the key recessionary signal from an hours’ standpoint, the other two are nonetheless valuable forward guidance.
All else equal, a weaker path for hours worked reduces growth forecasts. Let’s get real, though, ceteris paribus only exists in economic textbooks. The GDP building block of productivity is not a static indicator. Though productivity averages and trends over time, purchasing managers’ indices (PMIs) provide realer time tracking. To that end, S&P Global’s U.S. composite PMI for output and employment acts as a whole-economy productivity proxy. Think of it as the relationship between output and labor, which similarly is the makeup of productivity. While the proxy is (orange line) not a perfect guide, its downshift in the three months ended December (pink line) suggests productivity growth in the current cycle has yet to bottom. The yield curve, inverted to levels only comparable with the early 1980s (light blue line), reinforces productivity’s downside risk.
A more challenging environment for productivity raises the risk for more aggressive labor cost cuts. And yet, there are already signs of peak labor cost inflation (blue line) irrespective of any downward revision to today’s third quarter figures. The collapse in CEO expectations (not illustrated) is one piece of evidence. A peak in the Quits cycle is another.
To that end, job leavers (red line), or voluntarily quits, are overlayed with labor cost inflation. At 15.9%, September marked the cycle top and pushed the third-quarter average to the same cycle high (at 15.3%, depicted). October and November, however, saw a pullback to 14.6% and 13.9%, respectively. This echoes, with a lag, the November 2021 peak in nonfarm Quits from the Job Opening and Labor Turnover Survey.
Inflection points in the money grab aspect of wage trends occur late in the business cycle before recession seizes. A similar construct is unfolding in real time. Job cuts at Wall Street investment houses Goldman Sachs and Morgan Stanley and the announcement that Bank of America will slow hiring as the recession approaches reinforce the top in the labor cost cycle. Powell will get his wish.

