


The Fifth Horseman
“Outlined against a blue-gray October sky, the Four Horsemen rode again. In dramatic lore they are known as famine, pestilence, destruction, and death. These are only aliases. Their real names are: Stuhldreher, Miller, Crowley, and Layden. They formed the crest of the South Bend cyclone before which another fighting Army team was swept over the precipice at the Polo Grounds this afternoon as 55,000 spectators peered down upon the bewildering panorama spread out upon the green plain below.”
Grantland Rice, October 18, 1924, The New York Herald Tribune
Renowned for his elegant prose, Rice’s opening is arguably the most famous in football history. It elevated the Notre Dame backfield to football immortality following a 13–7 upset victory over a strong Army team. Those four Fighting Irishmen came to be known as the Four Horsemen of Notre Dame who rode straight into the Rose Bowl. A 27–10 win over Stanford that January 1925 capped off a 10-0 record giving Head Coach Knute Rockne and Notre Dame the national championship.
The Four Horsemen of the dismal science are coincident indicators closely tracked by the arbiters of business cycle designation, the National Bureau of Economic Research (NBER). As the recession narrative crescendos, Nonfarm Payrolls, Industrial Production, Real Personal Income Less Transfer Payments, and Real Business Sales, will be doubly scrutinized.
Especially after last week’s fireworks, aside from Federal Reserve Chair Jerome Powell’s comments in Stockholm yesterday and tomorrow’s Consumer Price Index, we foresaw little on the week’s skinny economic docket with the potential to be explosive. We expected November Consumer Credit to stay sky-high -- credit card spending has increasingly offset dissipating income growth as the ranks of sidelined U.S. workers collecting unemployment insurance has risen by 30% off its low. But we know claims, a leading indicator (claims) will take time to manifest in the coincident Unemployment Rate.
And then came the usually ho-hum Wholesale Sales. A biology lesson: Real Business Sales, monitored really closely by the NBER, can be dissected into Manufacturing, Wholesale and Retail Sales. Taken together, this top-line revenue proxy spans the production and distribution chains. While the figure used to date recessions is adjusted for inflation, today’s analysis focuses on what we’ve gleaned from nominal sales.
Had “Actual” Wholesale Sales on Bloomberg’s ECO page not had a minus sign in front of it, we might have missed it. In addition to November (coincident is synonymous with lagged) sales coming in at -0.6% vs. a forecast +0.2%, October was revised down to 0.0% from +0.4%. Even in boring data, a 1.2-percentage-point swing is a big deal. Tacked on to manufacturing and retail sectors, we saw that all three business sales components registered sequential declines over the month. This rare trinity has occurred just 9% of the time -- in 60 of 670 months since 1967. That said, aligning these three does not guarantee the economy is in recession. Aside from November 2022, only 26 of the 59 months the three contracted in unison, the economy was in recession or within six months of the start point, a 44% hit rate.
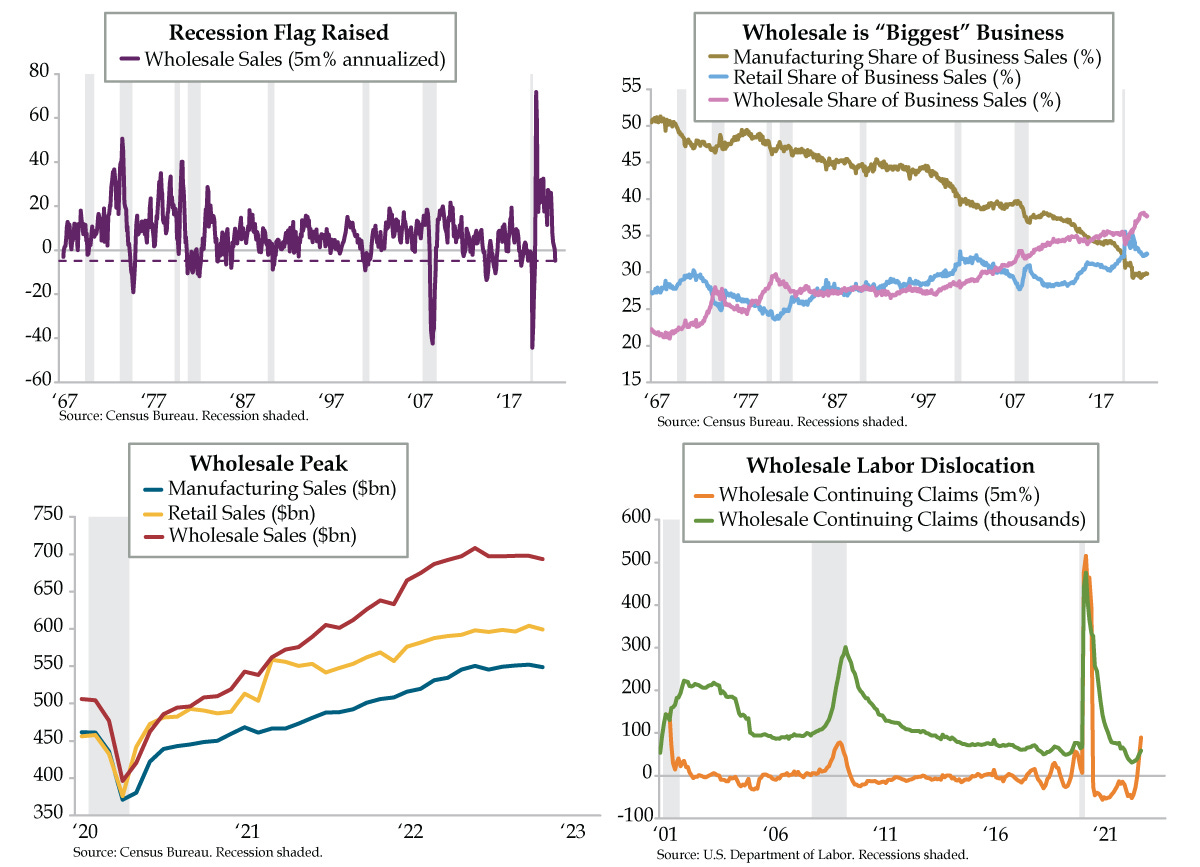
Digging deeper, decimal-point-style, November isn’t the only month Wholesale Sales printed negative. There have been four unrounded MoM declines in July (-1.54%), August (-0.01%), October (-0.04%) and November (-0.58%). A more accurate depiction of 2022’s second half culminated with a -4.8% annualized decline in the five months ended November (purple line). Compressions of this magnitude were documented in the recessions of 1973-75, 1981-82, 1990-91, 2001 and 2007-09 as well as the oil bust in the mid-1980s and the industrial recession in the mid-2010s. As a standalone, Wholesale Sales have raised a recession flag.
The temptation to dismiss Wholesale Sales is grounded in GDP’s construct. Manufacturing Sales (shipments) of Nondefense Capital Goods Excluding Aircraft feed into Business Equipment Investment. Retail Sales directly feed personal consumption. But Wholesale Sales aren’t part of final sales of goods. That shouldn’t, however, diminish their import. As the U.S. transitioned from an industrial to a consumption-based economy, with more goods sourced via imports, the significance of Wholesale Sales grew. As a share of total Business Sales, wholesale now makes up the largest share at 37.7% (pink line), a footprint it’s held since 2016. Since the pandemic, wholesale has gained on manufacturing (29.8%, brown line) and retail (32.5%, light blue line).
At $708.2 billion, Wholesale Sales’ June peak (red line) has not been corroborated by the single-month November contractions for both manufacturing and retail sales. That said, prior peaks in this metric reliably guided recessions in February 1970, September 1974, February 1980, August 1990, and June 2008. Other cyclical high points in January 1981 and December 2000 preceded recession by six months and three months, respectively. With the proviso that it was in the midst of the trade war, August 2018’s is the sole non-recessionary flag.
Despite the track record, today’s investors will disregard any and all data until validation lands in the form of obvious labor market distress. From that angle, the wholesale economy is unequivocal. At nearly 31,000 on a seasonally adjusted basis, June’s continuing jobless claims in wholesale trade coincided with the peak in Wholesale Sales. By November, the number had more than doubled to 59,000 (green line). Given its higher status ranking in an import-dependent economy, with the number of claimants up 89% in five months (orange line), the wholesale sector could easily be its own Horseman.