Kamehameha Dynasty Greets Stagflation

Yesterday, we celebrated the birth of our nation for the 246th time. Today, we celebrate the full roster of states. Don’t you know? It’s National Hawaii Day. In 1959, Hawaii became the 50th – and final – state to join the Union. Comprised of eight islands, the Aloha State has been inhabited for 2,000 years by Polynesians who navigated the Pacific Ocean to Hawaii’s shores in double-hulled vessels from the west. Ruled for generations by the Kamehameha dynasty, Hawaii has also long been a strategic military installation vital to U.S. Naval operations. The infamous surprise attack on Pearl Harbor shocked a nation and propelled it into World War II. In the here and now, the islands’ beauty and traditions draw visitors to its pristine beaches and majestic volcanoes. Hawaii’s exotic atmosphere speaks to a richly diverse warm heritage. For those who don’t speak the native language, the first word is ‘aloha,’ for love, affection, peace, compassion, and mercy. More commonly, it’s simply a greeting of ‘hello’ or ‘goodbye’.
Today’s credit managers are saying aloha to industrial stagflation. On the surface, the National Association of Credit Management (NACM) credit managers’ survey for June indicated a downshift in top-line sales activity but not recession. Qualitative comments from respondents in the manufacturing industry, however, exposed a marked decline in new orders. Others in the industrial complex stated that sales looked robust because higher input prices were being passed through; the dollar amount of sales stayed steady in the face of orders contracting significantly.
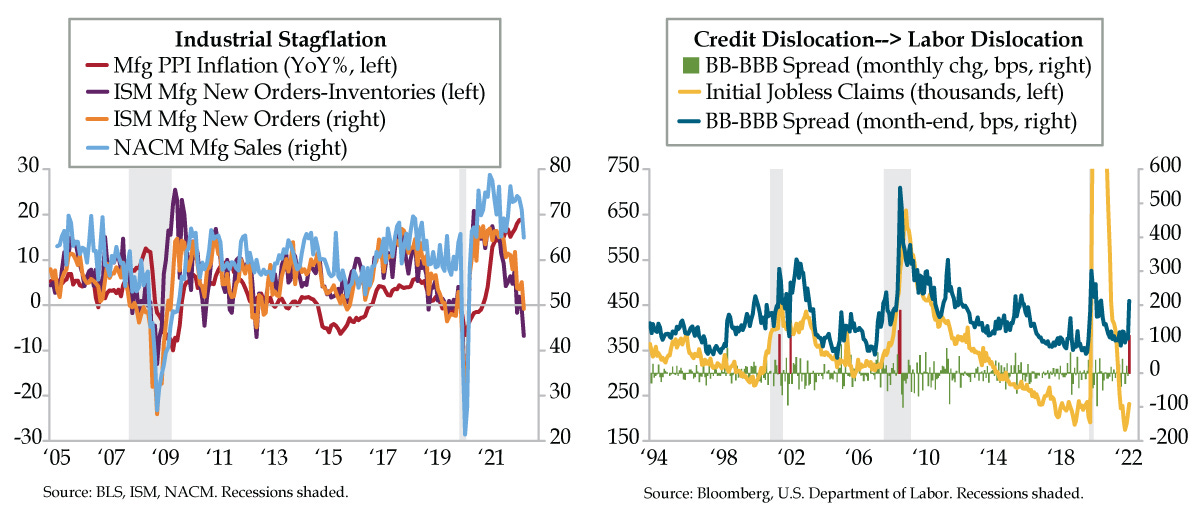
Pricing power in the factory sector has been evident for more than a year. In the 13 months through May 2022, manufacturing PPI inflation expanded by double digits; there’s no crest in sight (red line). As if on cue, last Friday, June’s Institute for Supply Management’s (ISM) manufacturing new orders index fell to 49.2, posting the first contractionary reading below the 50-breakeven-mark for the first time since the pandemic hit (orange line). NACM manufacturing sales (light blue line) continue to levitate because of prices, not the volume of activity.
NACM’s take is worth exploring and includes an element of denial: “While the CMI manufacturing sector index is strong enough for optimism, our respondent comments have shifted towards pessimism. Earlier in the year, they indicated that some customers were overordering so that they could build inventories and increase their customer satisfaction. We now see that they were successful, maybe too much so. The decline in sales momentum is consistent with the buildup of inventories and is not necessarily cause for worry economically speaking, especially since the CMI sales index is still robust at 64.9 points. But the shift in participant comments does indicate a growing uneasiness among respondents.”
Nominal activity driven solely by prices ups the ante on stagflation risk. For short-run guidance, we turn to ISM’s demand-supply metric -- the new orders-inventories spread. It’s quickly collapsed below the waterline to -6.8 in June, a level consistent with the past two U.S. recessions (and the Euro Area recession in 2012). NACM’s stockpiling anecdote is intersecting with a durable manufacturing slowdown that risks a break lower in the NACM manufacturing sales index.
Industrial oversupply is not unique to the U.S. Of the 17 developed market (DM) countries we track, besides the U.S., 12 countries reported negative new orders-inventories spreads in June: Australia, Austria, France, Germany, Ireland, Italy, Netherlands, Spain, U.K., Japan, Norway, and Sweden. The follow-on deflationary effects on nominal sales of a second straight month of wide breadth have yet to be felt. Cyclical risks of this ilk manifest across credit markets expressed through portfolio managers’ aversion to lower quality buckets, which is most visible at the Mason-Dixon Line between investment grade (IG) credit and high yield (HY) credit -- the BB-BBB spread.
By the end of June, the BB-BBB spread shot up 110 basis points (bps) to 212 bps from 102 bps at May’s month-end. For perspective, the long-run trend for the spread is 157 bps. Moves to an above-average setting aren’t unusual, but the speed at which this shift took place clearly was an outlier. Since 1994, there have been five other months when spreads decompressed by 100 bps or more (red bars), four of which occurred during recession while the fifth coincided with 2002’s accounting scandals.
Today, we say aloha to employment week, the almost regular monthly check-in with all things labor oriented. To that end, big breaks in the BB-BBB spread have coincided with dislocation in initial jobless claims. Our count of states with rising jobless claims has gone from one to six by the end of June. Persistent excess supply signals will add more manufacturing intensive states to the list and raise the aggregate claims count in its wake. This is how garden variety recessions get their start, from the manufacturing sector outward.
For the (not) record, for the first time in as long as we can remember, Wednesday’s ADP pre-nonfarm payrolls installment is not in the queue; it’s in the shop revisiting its model, which is, well, off, in the post-pandemic era. We have full respect for ADP given it’s clear there’s something hinky in the Department of Labor and Bureau of Labor Statistics’ respective methodologies. The one we don’t doubt is Thursday’s Challenger, Gray & Christmas layoffs data – unless its basic math has broken down, the tally promises to be the worst since the post-pandemic trough ignited now-dying talk of a wage price spiral.


