


Just Not Got Paid
New jack swing is a fusion of the rhythms and production techniques of hip hop and dance-pop mixed with the urban contemporary sound of R&B. Producers Teddy Riley and Bernard Belle spearheaded the genre; its popularity peaked in the late-1980s to early-1990s. One party anthem from the era became a No. 1 R&B hit and peaked at No. 10 on the Billboard Hot 100. Bahamian native Johnny Kemp’s “Just Got Paid” was a feel-good tune: It’s Pay Day, you’re all dressed up, looking good, and have a full wallet. In The Billboard Book of #1 R&B Hits, Kemp explained: “I was trying to incorporate some of the contemporary language that was going on at the time, ‘lookin’ fly’ and ‘the posse’ and all that. It was something Teddy was working on with Keith Sweat and apparently Keith didn’t like it enough to put it on his record. I liked it enough to put it on mine.”
In economic circles, credit managers are paid to get paid, ensuring accounts payable steadily get filled on time. The alternative flags building credit stress. While purchasing managers are in the spotlight during the first week of every month, credit managers’ forward-looking natures make them more guides to inform the macro picture.
The National Association of Credit Management’s (NACM) Credit Managers’ Index (CMI) doesn’t command a designated spot-on Bloomberg’s economic calendar. That shouldn’t detract from its timeliness. In December, the CMI fell to 51.6, the third straight month of deterioration and the sixth in the last eight months. While the headline kept expanding, the 7.5-point compression in the eight months ended December was rivaled solely by the same stretch ending November 2008, during the Great Financial Crisis, a moment in time punctuated by a major credit event. (The COVID flash crash was excluded from the above comparison because of its technical nature.)
As is often the case with headlines, they fail to tell the whole story. From a qualitative standpoint (and bolding ours), the survey noted it was “the first time this year that the majority of respondents have not indicated problems with supply chains or logistics. Instead, they cited troubling trends in payments, with a marked shift in accounts 1-30 days past due, increasing demands for higher credit limits due to inflation and difficulty with collections. Some respondents indicated that they believe their customers with new delinquencies may be pushing payments into 2023 but are worried nonetheless that it indicates more financial distress building in the business sector.”
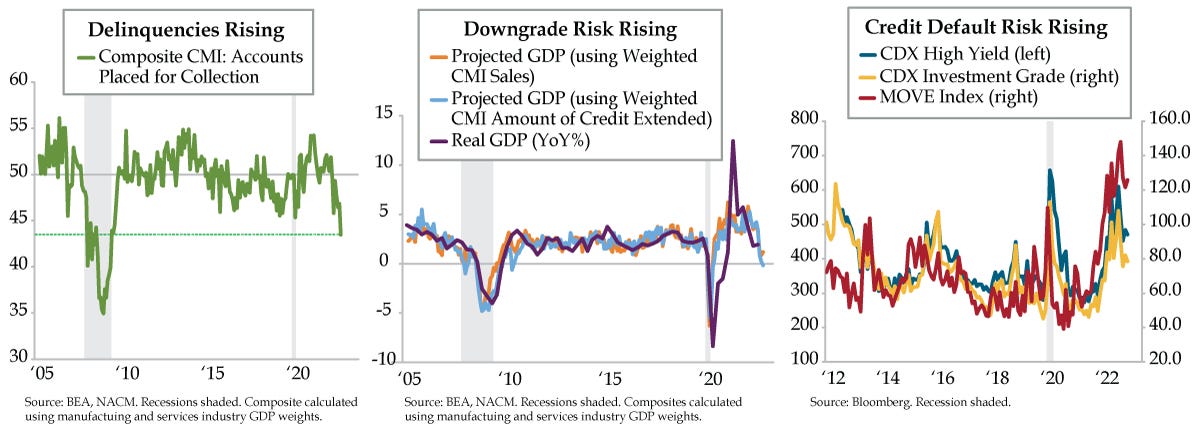
Our composite CMI for Accounts Placed for Collection combines the manufacturing and services measures for this index subcomponent and applies industry GDP weights to fuse the data into a tidy package. The picture painted is anything but. Last month, the aggregate fell to 43.5 (green and dashed line). When the economy entered the Great Recession in December 2007, it was at a level of 48.1. Two months later in February 2008, it fell to 40.1. In the series dating to 2005, we saw credit concerns surfaced early in recession, which seems in keeping with the present episode. In an interesting parallel to 2008, the broader service sector, not manufacturing, is driving the degradation in credit conditions.
In a harbinger of what’s to come in earnings season, when CMIs for Sales in manufacturing and services are normalized, both top-line series posted negative z-scores in October, November, and December. The Fed’s tightening campaign is crimping organic revenue growth while the inorganic variety is significantly challenged by a merger and acquisition cycle that clocked a record -49% year-over-year (YoY) decline in December. Naturally, the CMIs for manufacturing and services Amount of Credit Extended fell precipitously into year-end, echoing the start of recession. Sales and Credit Extended proxy GDP. Through December, the former yielded a 1.2% YoY increase, a significant downshift from the March peak (orange line), while the latter generated a -0.2% YoY contraction, the first of its kind since the Great Recession (light blue line). Both trends are below the official 1.9% YoY third-quarter gain (purple line).
QI’s bottom line: Tack cratering credit conditions onto the massive disinflation flagged in January’s ISM and conclude that the 65% consensus recession probability in the coming year is delusional. In 2008’s first quarter, rising Accounts Being Referred to Collections coincided with a -1.6% quarter-over-quarter (QoQ) annualized decline. Current market expectations of a 0.1% QoQ annualized gain for 2023’s first quarter are ridiculously high.
Many investors have sniffed out recession risk, but full capitulation is nowhere in sight. Credit default risk metrics for both investment grade and high yield buckets (yellow and blue lines) have come off their September 2022 highs. This improvement does not incorporate December credit managers’ observations but rather reflects rate volatility, as gauged by the MOVE index (red line), coming off last year’s highs as anticipation mounts that a Fed pivot is imminent…again.
In 2023, we see safe harbor in higher-quality corporate credits that capitalized on the Fed’s post pandemic overly easy policy and wisely extended their debt maturities at the lowest interest rates in history. They bought time at the right price. We equally see risk in a Fed that’s hell bent on whipping inflation (in name only) and in doing so, let the credit cycle run its course and slay the Fed Put. Credit managers are seeing blood in the water. Risky credits and private debt will not be thrown a lifeline.