

How Prices Fly, The Hitchhiker’s Guide Style
Douglas Adams was part genius and several parts madman. Thankfully, the madman wrote The Hitchhiker's Guide to the Galaxy. According to the Guide, the main thing that flying requires is the ability to throw yourself at the ground and miss; do so with all your weight and “the willingness not to mind that it’s going to hurt.” The difficulty is in missing the ground; doing so accidentally, as “deliberately intending to miss the ground” does not pass snuff. The Guide goes on to explain, “You have to have your attention suddenly distracted by something else then you’re halfway there, so that you are no longer thinking about falling, or about the ground, or about how much it’s going to hurt if you fail to miss it.” The Guide also advises not to listen to what others may say, as they could say something such as: “Good God, man, you can't possibly be flying!” It’s vitally important not to believe them or they’ll suddenly be right, and you’ll fail to miss the ground all over again.
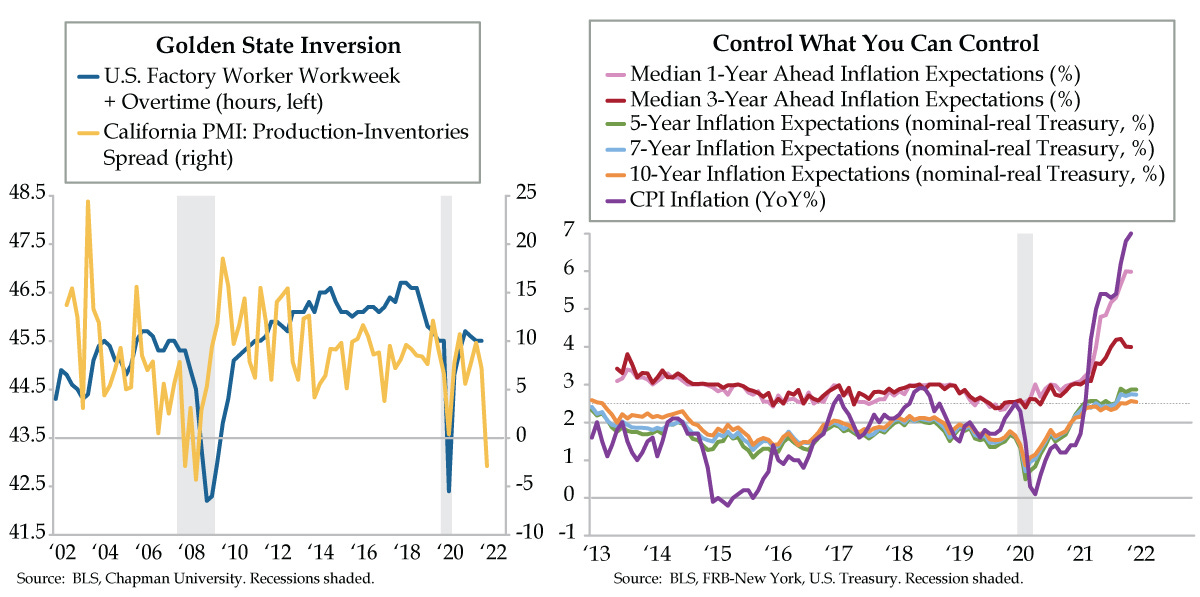
One of the key U.S. economic indicators that committed Adams’ advice to memory is the consumer price index (CPI). It’s difficult to believe that we were a bit concerned that February 2020’s CPI “clocked in” at a 2.3% year-over-year (YoY) rate. As the global pandemic unfolded, inflation started throwing itself at the ground. By May 2020, the CPI had succumbed to those to whom it listened, sinking to 0.1% YoY, as close to the ground as you can get. But then, the distractions started coming in. The CPI was so successful at missing the ground, by December 2020 it had glided up to 1.4%. On year on, it vaulted to a lofty 7.0% (purple line), the largest 12-month increase since June 1982 as media outfits blared ceaselessly yesterday.
Inflation is one thing. Inflation expectations are another altogether. Households sniffed out last year’s run-up in inflation. According to the New York Federal Reserve’s Survey of Consumer Expectations, median one-year ahead inflation expectations rose from 3% at the end of 2020 to 6% last month (pink line). Household’s medium-run outlook for the cost of living over the same timeframe also advanced from 3% to 4% December-over-December (red line).
Longer run inflation expectations extracted from the U.S. Treasury market never came close to that of consumers. That said, five-year (green line), seven-year (light blue line) and 10-year inflation expectations (orange line) all remained sticky at levels between 2.5% and 3% as last year closed out.
Moreover, the extended duration of the inversion of the inflation curve (i.e., shorter tenors higher than longer ones) has been an unusual construct. Pre-COVID, the inflation curve was steep (i.e., shorter tenors lower than longer ones). The persistence seen in the green and light blue lines running north of the orange one is no doubt keeping central bankers up at night, especially if they’re mandated to stabilize prices.
Cue Fed Chair Powell. At Tuesday’s Senate Banking Committee hearing, Powell testified that the economy has rapidly gained strength despite the ongoing pandemic, giving rise to persistent supply and demand imbalances and bottlenecks, which have manifested in elevated prices. He added that high inflation exacts a toll, particularly for those less able to meet the rising costs of essentials such as food, housing, and transportation. Powell’s avowal: “We will use our tools to support the economy and a strong labor market and to prevent higher inflation from becoming entrenched.”
Our bolded section is the key takeaway. The Fed can control – or at least strongly influence – how inflation expectations unfold in the Treasury market. It holds both nominal Treasuries and (real) Treasury Inflation-Protected Securities (TIPS) on its balance sheet. And it has the flexibility to decide the schedule of purchases and sales for both parts of the inflation expectations equation -- nominal minus real yields.
Just as ‘Not-QE’ un-inverted the yield curve, un-inverting is front and center at the Fed. Targeting higher real yields, especially in shorter dated TIPS, would help tame five-year and seven-year inflation expectations. Tapering TIPS QE (quantitative easing) and transitioning to TIPS QT (quantitative tightening, reducing TIPS holdings) would engineer the technical flows required to raise real rates and compress higher inflation expectations, preventing them from becoming entrenched. As we’ve been writing, a hawkish Fed should continue to give fright to passive TIPS tourists in the asset class. Their flight only furthers the Fed’s alchemistic designs.
The economy of the largest U.S. state has some sway in this dynamic. The Chapman University California purchasing managers’ index (PMI) revealed an inversion of sorts: demand running below supply. At 62.2, the Production index eased to a two-year low in 2022’s first quarter, while the Inventories index, at 65.1, rose to a record high. The resulting -2.9 Production-Inventories level (yellow line) was only the third time this demand-supply spread dipped into negative territory in the 20-year history of the survey. For posterity, the other two subterranean moments occurred during the 2007-2009 recession.
The Golden State did not read the Guide and will need practice flying. In the interim, regular and overtime hours put in on assembly lines in the factory sector (blue line) are at risk of a downward correction early in 2022 based on the signal emanating. This fundamental deflationary impulse could also help the Fed out. As was the case with ‘Not QE,” market veterans will see straight through such blatant machinations.