Holy Cannoli!

Beverly: “The City Steakhouse serves the best beef in town, their sensual setting will set the mood for any romantic rendez-vous” Oh, hear that Hank?
[Beverly rubs Hank’s leg while giving another giant smile, Adam Sandler starts cracking up]
Hank: Give me cancer now, God!
Beverly: (reading) “Find southern fare at Charlie’s, there’s fried chicken and first-rate sevice, so come on down y’all, y’hear?”
[Hank grabs the book and rips it up, then there’s a moment of silence.]
Beverly: Hank and I have decided to spend a nice quiet evening at home, isn’t that right, Hank?
Hank: The book is gone,but the mouth goes on!
Beverly: Since we’re staying at home, maybe we can watch some television. Let’s find a show to watch in our…TV Guide! (picks up a TV Guide)
Hank: Just when I thought I was out, she drags me back in!
Beverly: Oh, here’s one, “Murder She Wrote”, Jessica investigates a suspicious Hollywood murder and exposes the real killer. Oh, I just love her, she’s so smart! (She gives another big smile)
Hank: See if there’s a program about shutting the hell up!
It’s Friday. And it’s been a whip of a week in the markets. Open UP, close DOWN. With due deference to Leading Indicators, which have a distinctly lagging feel of late, the circumstances demand a bit of levity given today’s data vacuum in this fifth-to-the-last day of FOMC blackout. Hence our sharing one of Saturday Night Live’s classics featuring David Duchovny, Chris Farley (R.I.P.) and Adam Sandler as the victim in the “middle of a moron sandwich” listening to “stupid in stereo.”
What harkened this particular skit was our initial reaction to Thursday morning’s initial jobless claims print: “Holy Cannoli!” Hitting the highest since mid-October, at 286,000, seasonally adjusted claims blew past consensus estimates of 250,000 and were up appreciably from last week’s 231,000. Last week, we delved into the not-seasonally-adjusted data with good reason – the pandemic has wreaked havoc on the bean counters’ capacity to account for the normal ebbs and flows of the data. Omicron, which we’ve tired of hearing, no doubt pulled countless thousands out of the workforce, a phenomenon exacerbated by difficulties in the seasonals. That said, as was the case last week, a trend has emerged with the seasonally adjusted series up in five of the last six weeks. More importantly, the much more devastating Delta variant didn’t make a dent in claims’ downtrend suggesting something more fundamental is at work.
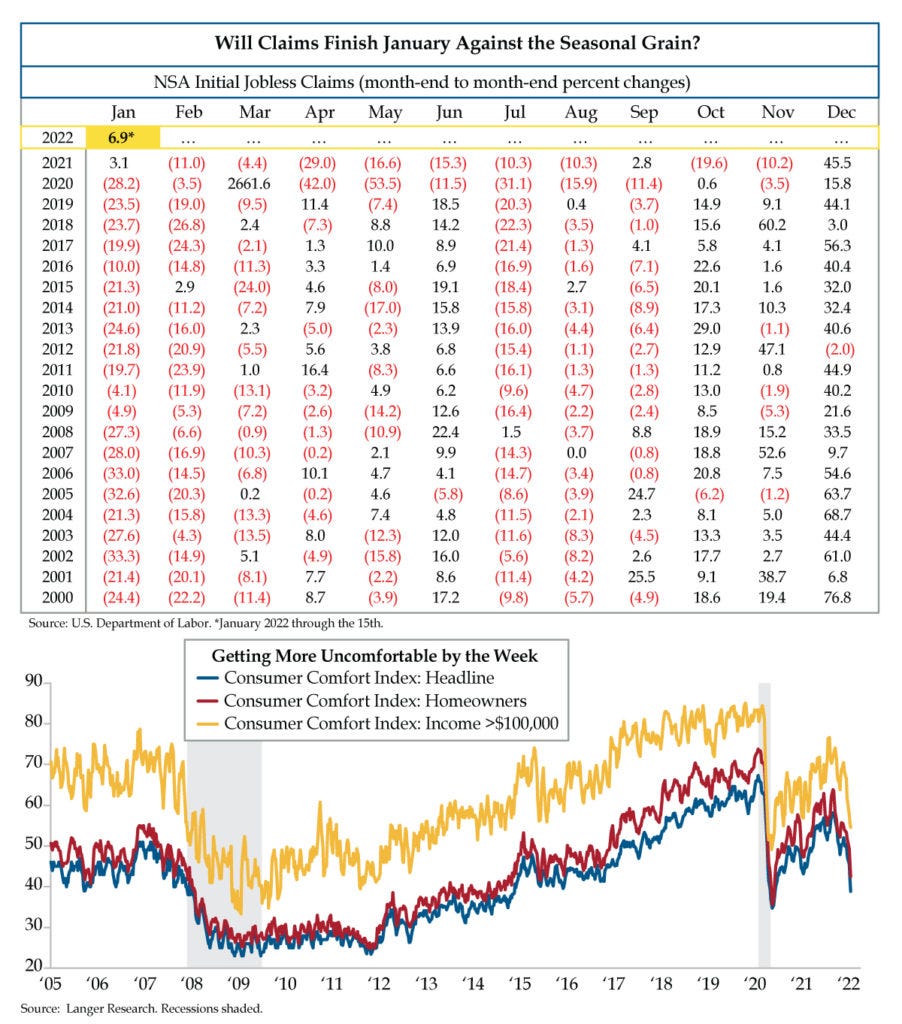
Switching back to the noise-reducing not-seasonally-adjusted series, as you see in today’s excruciatingly detailed top table, which we’d ask you to study, Omicron notwithstanding, January is shaping up like a salmon swimming upstream. Weekly jobless claims data in the raw data show regular seasonal patterns over the course of a calendar year. January was traditionally one of those months that defined consistency, at least over the last two decades -- fewer filers for unemployment insurance from the end of December to the end of January. Denoted by the distinctly black ink, last January broke that streak. Tentatively, with two weeks in the books, January has also de-trended. Should the bump up be sustained in the last two weeks of January, it would build conviction for an emerging inflection point.
We’ll hold off on delivering a verdict but suspect we’re at the precipice of something that’s yet to be defined. Consider this from Langer’s weekly Consumer Comfort Index, which we’ve increasingly relied upon in an era that prizes real-time data: “The grip of decades-high inflation pushed Americans’ ratings of the buying climate to a nine-year low this week and assessments of the national economy to their largest single-week drop since the onset of the pandemic, leaving the overall Consumer Comfort Index its lowest since June 2020 (blue line).”
Peering out over the horizon, expectations have also turned south with 56% reporting the national economy is getting worse, up six percentage points (pps) in a month and 18 pps since mid-November. Gauged off this one metric, we’ve round-tripped to May 2020. Moreover, a scant 16% say the economy is improving, down seven pps since December and 22 pps since August to match its lowest in nearly a decade.
Truly stress-testing the Langer data required a drill down to those who have benefited the most from the Federal Reserve’s policies that have pumped up housing and stock prices. They should, in theory, be the most agnostic to the depletion of fiscal stimulus and reduction in Fed liquidity and therefore represent the least drag on the headline. And yet, those who make $100,000 or more, a.k.a. owners of equities, are the dourest since May 2020 (yellow line). Homeowner sentiment has similarly retreated to the lowest since June 2020 (red line). We expect these readings from inflation-wracked renters and those no longer on the receiving end of the child tax credit, in addition to the full milieu of post-CARES Act stimuli, all things considered. But the cohort that defines the “wealth effect”?
For those statisticians among our readership, Langer’s headline has a tight 0.72 correlation with the Dow Jones Industrials. In light of that tight relationship -- even with the 2s/10s spread at 77 basis points, 5 shy of its post-pandemic-peak tights as validating evidence – what’s come to pass in equities is not all that surprising. To mix entertainment metaphors, we suggest you, “Leave the gun” and “take the cannoli.”


