


Here Comes the Boom
Let’s start the New Year outside the box. Over the second long weekend in a row, we had the chance to share Here Comes the Boom with a new generation. Mercilessly pilloried by the critics, you’re forgiven if the name doesn’t ring a bell. But c’mon! Name one other flick that brilliantly weaves together School of Rock, Rocky and Neil Diamond’s “Holly Holy”? The protagonist: Former collegiate wrestler, Scott Voss (Kevin James), a 42-year-old, apathetic biology teacher in a failing high school. With cutbacks threatening the school’s music program and its teacher (Henry Winkler), Scott finds his calling. Dusting off his wrestling skills, he earns money to save the program moonlighting as a mixed martial arts fighter. Of course, Voss lands in Las Vegas matched up against Ken "The Executioner" Dietrich. On his knees after two rounds, the band students rally around their hero, who prevails in the final round, winning $50,000, just enough to save the music program.
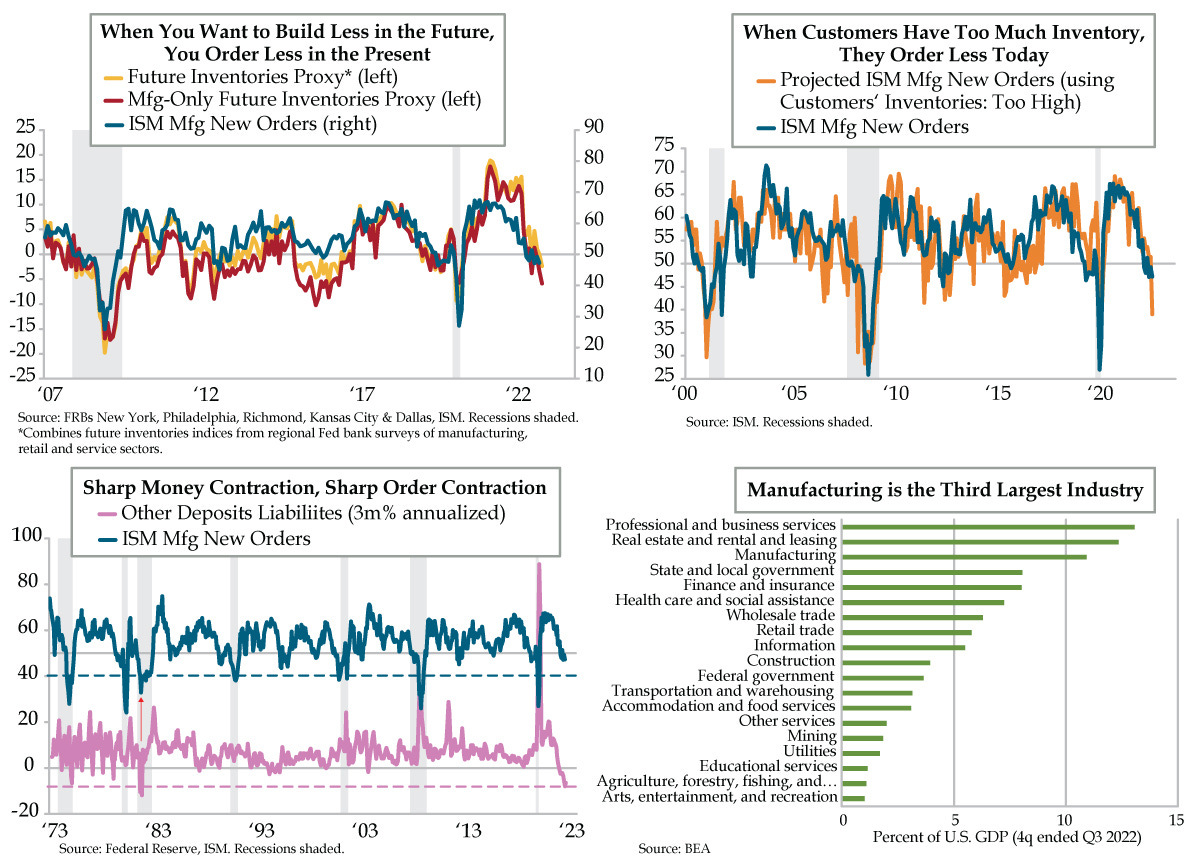
Rather than a boom, a bust inspired 2023’s first missive. Knowingly defying the consensus, we see a real possibility of a sub-40 print when tomorrow’s Institute for Supply Management’s (ISM) manufacturing New Orders index hits. Our logic is simple: To build less in the future, order less today. QI’s future inventories proxy leads this metric and has notably slipped (yellow line). In December’s regional Federal Reserve district factory surveys, we saw sharp swings from expansion to contraction in Kansas City and deeper contractions in New York and Philadelphia. Importantly, manufacturing-only indices of future inventories (red line) underperformed the aggregate figure, which incorporated expectations for services and retail supply. Critically, all seven regions (raw materials and finished goods) contracted in December, a 98th percentile event.
Embedded within the ISM is corroborating evidence. When Customers’ Inventories rise too much, orders are cut. No surprise, Customers’ Inventories and New Orders have a long-standing inverse relationship. At 48.7, the former tacked on a sharp 7.1-point increase in November, (read: bad), the fifth largest since the index’s 1996 inception. ISM’s rose-colored glasses take: Stockpiles were “just right”. To backcheck the Goldilocks interpretation, let’s parse respondents’ three potential assessments of supplies on hand: “too low,” “too high,” and “just right.”
Normalizing via z-scores, the number of standard deviations from the mean, yielded “too low” of 0.15, “too high” of 1.91 and “just right” at -1.34. If customer inventory levels were “just right,” its z-score would be zero, not more than one standard deviation below normal. To ISM’s credit, they did caution that Customers’ Inventories were “no longer providing positive support to future manufacturing expansion.” When the z-score is translated to its usual units, 20.6% of U.S. manufacturers said they had too much stock on hand. There is no historic parallel of this gauge being north of 20% when the economy wasn’t in recession.
Moreover, three key sectors – wood products, primary metals, and chemical products – reported customer supply as “too high” in November. These three upstream industries provide vital inputs downstream in areas such as construction and manufacturing. Something downstream from a demand perspective must have turned for the worse in these cyclical sectors. As a case in point, last Thursday, steel giant U.S. Steel Corp. announced layoffs from a Gary, Indiana tin operation it’s idling indefinitely. The 244 affected employees are casualties of market conditions with the Pittsburg-based 122-year-old operator citing reduced demand and “significantly increased” tin mill imports, which rose 30% in 2022. Isolating the November “too high” reading to create a one-factor model to project ISM New Orders yielded 39.0 (orange line), well below the actual 47.2. In keeping with QI’s “recession recognition risk,” a sub-40 print would add to last week’s continuing claims’ contractionary signal.
Friday’s ISM Chicago release highlighted a third gauge that further corroborates recession is underway – capacity utilization, which fell nationwide to 79.7% in November from 79.9% the prior month. When manufacturers in the Chicago region were queried about prospects for this lagging indicator in 2023, 53% optimistically said they foresee capacity utilization running north of the national level. As for the balance, 18% see the need to utilize 75% of their capacity, idling 25% while 12% say capacity utilization will fall to less than 70%. So cloudy is the outlook for the remaining 18%, they can’t say what their needs will be.
Exacerbating pressure on the broad economy is incessant liquidity depletion. Using Lacy Hunt’s favorite money supply gauge, other deposits; liabilities (at commercial banks), we clock short-run compression in the three months ended November at a -8.0% annualized (pink line) clip; through the week ended December 21st, the liquidity reduction intensified. It has but one precedent -- October 1981, a timestamp followed by a four-month stretch of ISM New Orders below the 40-mark (blue line).
In the postwar period, the U.S. economy has evolved into a service sector powerhouse. The flipside: The share of manufacturing has drifted down from 1953’s peak of 28% of GDP to 11% in the four quarters ended October 2022. Even through the structural shift, manufacturing remains the third largest industry behind professional and business services and real estate. After China, which accounted for 28.4% of global manufacturing last year, the U.S. came in at 16.6% followed by Japan 7.2%), and Germany (5.8%). Though not what it once was, signals from the U.S. factory sector should never be dismissed. Headed into the new year, executives throughout the economy are sure to pay heed.