


Her Majesty, the Gear Head
Her Majesty, the Gear Head
In December 1952, ten months after Queen Elizabeth II ascended to the throne, General Motors completed the first Chevrolet Corvette prototype. The first model rolled off the assembly line in June 1953, celebrating Her Majesty’s coronation that month. As noted by TopGear.com, the monarch “was a keen motorist and trained as a mechanic and lorry driver towards the end of the Second World War, so eager was she to assist in the national effort.” At her father’s behest at the age of 18, the princess joined the Auxiliary Territorial Service where she was trained to maintain, service and drive army trucks for five months earning her the press label, ‘Princess Auto Mechanic’. During her reign, the Queen enjoyed a vast array of British cars building an eclectic collection including the Rover P5 B, the Vauxhall Cresta estate, and a Jaguar X-Type wagon, alongside Rolls-Royce and Bentley. Her true passion was Land Rover. Her Majesty’s fondness for Defenders and Range Rovers was well documented. She was chauffeured in specially prepared royal variants while on tour in Britain and around the world, and she preferred them for her personal use on her estates.
Auto inflation likely never played into the buying decision for the Royal collection. For the U.S. consumer price index (CPI), however, vehicle pricing has driven the inflation narrative. In August, used car and truck prices advanced at a 7.8% year-over-year (YoY) rate, up from July’s 23-month low of 6.6% YoY, but well below February 2022’s 41.2% high. New vehicle prices rose by 10.1% YoY pace, a 10-month low, down from April’s post-pandemic high of 13.2%. With Cox Automotive finally acquiescing yesterday that applications to buy cars fell 16% YoY last week, “with a declining trend,” we suspect there’s plenty more on the downside for prices.
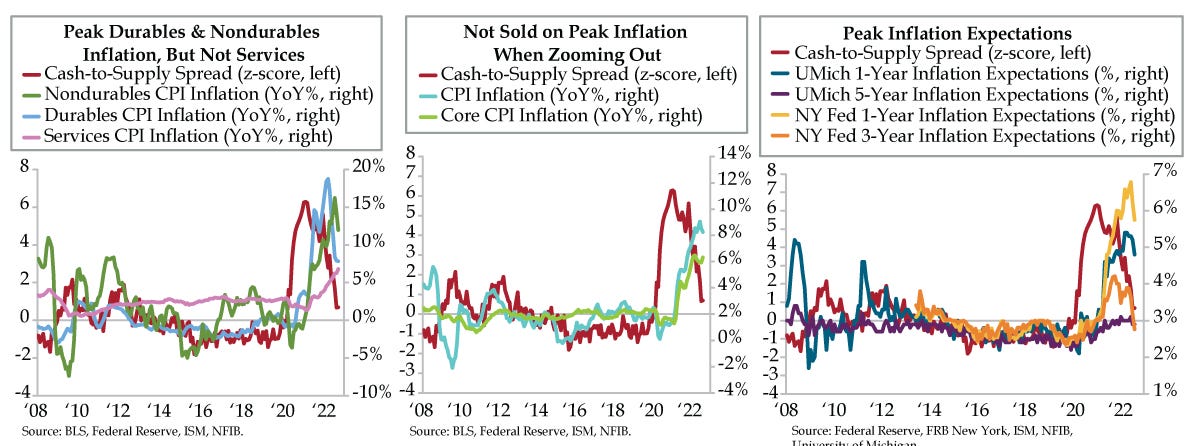
Auto inflation peaking has largely dictated that of durable goods which eased to a 7.8% YoY rate (light blue line, left chart), further off February’s 18.7%, a high back to March 1942. Many home-related goods did not get the memo. The following posted record high August inflation rates between 11% and 15%: floor coverings, dishes and flatware, outdoor equipment and supplies, paper products, and miscellaneous household items.
Peak nondurables also fell to 12.0% YoY in August (green line, left chart) from June’s 16.2% pace, which was a high back to June 1947. Blame energy: Gasoline fell 7.7% month-over-month (MoM) in July and another 10.6% in August. That said, at 13.5% YoY, food at home and that of food away from home, at 8.0% YoY, registered the highest inflation rates since March 1979 and November 1981, respectively.
Fancy a trip to your local grocer? Clocking in with the largest annual gains on record were flour and prepared flour mixes, fresh biscuits, rolls and muffins, crackers, frozen bakery products, lunchmeats, dairy products (ex-milk, cheese, and ice cream), canned fruits, frozen fruits and vegetables, candy and gum, butter and margarine, frozen and prepared foods, snacks, and spices, seasonings, condiments, and sauces. Perhaps that backdrop helps contextualize how callous it was to host a garden party lauding the “Inflation Reduction Act” while markets melted yesterday amidst Americans reducing the volume of food they consume.
Services inflation ran counter to the peak inflation theme. In August, it posted a 6.8% annual inflation rate (magenta line), the highest since October 1982. Note: the Services CPI is a lagging indicator that rises at the end of a cycle and through a recession and should not be used for forward guidance.
The elephant in the room in all three charts is the cash-to-supply spread. It is a leading indicator of price trends in goods, not services. Recall, the construction of this gauge is the difference between two z-scores, one for money growth (other non-time deposits at commercial banks) and one for inventory sentiment (composite of large and small businesses; data sourced from the Institute for Supply Management and National Federation of Independent Business). This too-much-money-chasing-too-few-goods guide has eased under a +1 (red line) as demand (i.e., money) has fallen back below trend.
If you only glanced superficially at your Bloomberg ECO (economic calendar) page yesterday without looking under the Vette’s hood, peak inflation would not have been your takeaway. Both headline (light blue line, center chart) and core (green line, center chart), came in north of market expectations, igniting a firestorm of rate speculation ahead of next week’s Fed meeting.
In yesterday’s early-afternoon trading, rates traders were pricing near coin-flip probability between a 75- and 100-basis point (bp) September rate hike before things settled back to about 33% odds of a full point later in the day. Even the yield curve took off on a knee-jerk bear flattening before ending the day in twist flattener territory – 2-year yields closed up 18 bps while the long bond ticked down 2 bps.
The one silver lining is peak inflation expectations. Short- and medium-run household inflation expectations have rolled over according to the New York Fed (yellow and orange lines) and University of Michigan (blue line); the key long-run metric (purple line) also has eased. Like with durables and nondurables inflation, here too, the cash-to-supply spread provided reliable forward guidance for a topping process to ensue. Like Queen Elizabeth whizzing by in a Corvette rather than her practical preferred Land Rovers, this is small consolation for stock investors. With one week to go, the Fed is boxed in to at least a 75-bps hike.