Funover

BILLY: Hey Judy, why the long face?
JUDY: Well, Billy, I went to Palm Springs with my cousins last weekend, and we lived it up like it was 1965. We had a four-hour dinner, too many martinis to count and we danced to Sinatra tunes 'til 2am. It was great but now old man Whethers over at HQ is riding me about this marketing data, and it sucks to be back at work.
BILLY: Sounds like you've got a mean funover to me.
JUDY: Yes, I do have a funover.
Urban Dictionary defines “funover” as a play on the word "hungover." It’s basically a hangover from fun, the unshakable letdown sensation when you come home from good times away. An inability to function as a productive human being in the aftermath of such frivolousness is nearly paralyzing, kind of like Federal Reserve Jerome Powell trying to remove the punchbowl from May 2020 through March 2022. A funover may last between a day and a week, though residual symptoms may continue for up to months afterwards if daily stress levels are high, or years in the case of the Fed and the vestiges of a Quantitative Easing sabbatical.
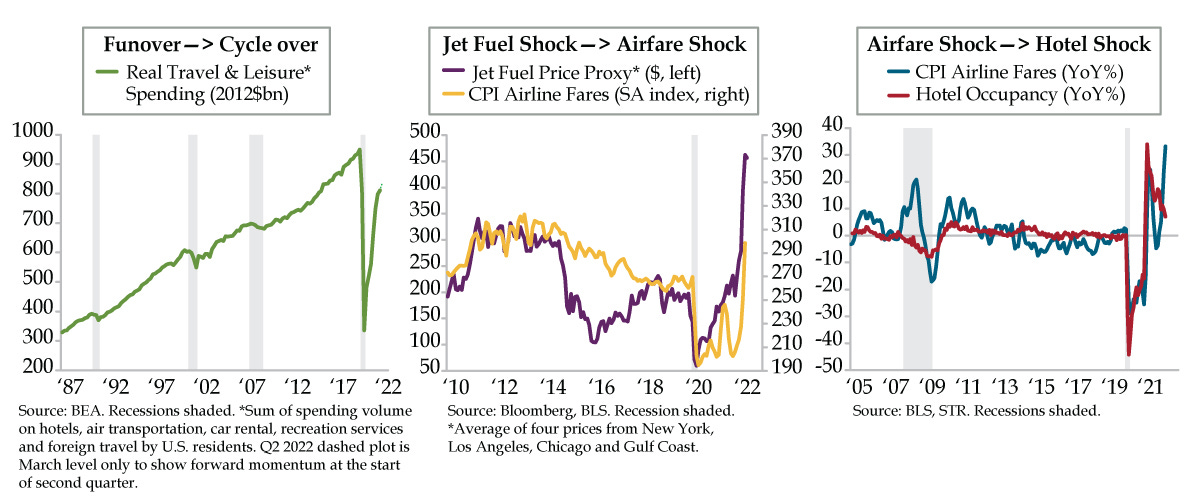
We took the funover phenomenon and added the fourth dimension of time. And in typical QI fashion, we drew a picture of it. Real travel & leisure spending is the best fit for economists as it equals the sum of spending volume on hotels, air transportation, car rental, recreation services and foreign travel by U.S. residents. Historically, these five categories account for a not insignificant 10% of U.S. consumer spending on services.
Funover is a cyclical indicator too. When it peaks, so does the business cycle. Recession follows, the macroeconomic version of a hangover. Over the last four cycles since 1990, real travel & leisure spending acted as a leading indicator, topping out early prior to the 1990-91, 2001 and 2020 recessions by one quarter, two quarters and one quarter, respectively. For the 2007-09 recession, real travel & leisure spending reached its high at the onset (green line).
By the looks of it, funover does not look like it’s ending in the current quarter. Part of our conviction is grounded in the momentum at the end of the first quarter. The March level for travel & leisure spending stands nearly 15% annualized above the Q1 average (dashed part of green line).
That doesn’t mean it’s all rainbows and butterflies, though. The Russian invasion of Ukraine set off ripple effects across global energy markets. Jet fuel prices soared on the U.S. East Coast, home to some of the world's busiest airports, as buyers anticipated a worsening shortage amid sanctions on Russian energy exports. The East Coast largely relies on shipments from the Texas-to-New Jersey Colonial Pipeline for refined products, as well as imports from Europe. However, Europe is dealing with its own supply strains, so distillate exports to the East Coast have fallen off precipitously.
Our jet fuel proxy that combines prices from New York, Los Angeles, Chicago, and the Gulf Coast has spiked significantly since Russia’s action (purple line). Notably, price gains in New York rose nearly 120% from the end of February through the latest available May data, three times greater than the 40% advances in Los Angeles, Chicago, and the Gulf Coast.
As part of their standard operating procedures, airlines hedge their positions in jet fuel. In normal times, movements in prices can be offset to allow for smoothed earnings. A shock of the magnitude that’s unfolded since late February, however, cannot have been preemptively factored in. What’s an airline to do?
Apparently, the answer is to pass the cost along to the consumer. Yesterday’s Consumer Price Index (CPI) report revealed that airline fares, which account for a miniscule 0.5% of the total CPI, rose 18.6% in April (yellow line), the largest one-month increase since the series’ 1963 inception. In fact, airfares accounted for 0.1 percentage point of the 0.3% monthly gain in the headline index. Do the math; that’s one-third! Since jet fuel prices remain elevated so far through May, the price shock for airfares still has legs.
That could be a concern for hotel operators and businesses that rely on travel and tourism more broadly. The post-Russia/Ukraine surge in airfares pushed the annual inflation rate to 33.3% in April, the highest since the early 1980s (blue line). This presents a risk to the hotel recovery. The trend in hotel occupancy, that has a lower beta than airfares, is already on the downswing (red line). This reminds us of the divergence during the 2007-09 recession that generated a persistent downturn in occupancy. Back then, however, airfare inflation crested at 21%.
We’ve heard the news. Business travel has shown signs of reawakening. That leaves the budget-conscious personal leisure traveler expenditures in the crosshairs. We reiterate that travel & leisure account for ten cents of every dollar spent on U.S. services. The risk of outright contraction in the series should not be ruled out despite near-term momentum not having raised a yellow flag. We retort ourselves by pointing out that credit card spending has gone off the rails – it’s difficult to discern what’s real and what’s been supplemented in the realm of discretionary spending. One thing is for certain as layoff headlines multiply, the idea that travel is at risk throws cold water on the baton handoff to the services spending narrative.


