Cue The Athenian Bean Counters

The expression “bean counters” has a noble origin. Sprung 2,500 years ago from the Athenians, the beans chose the officials, not vice versa. Step One: Two people were selected in a random drawing to be responsible for running the bean machine. Step Two: Candidates put their names on pieces of paper randomly drawn, one by one, by the two officials. Step Three: Each drawn name was inserted into a column of slots in the machine according to the order in which they were picked. The verdict: If a seat in the Athenian assembly had 100 candidates vying for it, the officials had to count out exactly 99 black beans to go with the one white bean. Bean counters were guardians of democracy.
In economics, bean counters are the guardians of the business cycle. Their critical role: They tally the inputs that assemble gross domestic product (GDP). Bean counters are roundly ignored during economic expansions. When contraction creeps up as it did in the first half of this year, bean counters get many more knocks at their collective doors.
The cottage industry of nowcasting by Federal Reserve District banks has ebbed and flowed and largely been pilloried by the number seasonals have done on most models in a post-pandemic world. Call the Atlanta Fed GDPNow the last one standing; it continues to garner attention when it shifts with the wind. Yesterday, the model slashed its third-quarter U.S. GDP estimate down to 1.3% from 2.1% last Friday after disappointing results from the Institute for Supply Management (ISM) manufacturing survey and the construction spending report. Our favorite bean counters at S&P Global/IHS Markit lowered their third-quarter call to 0.6% from 0.9% at the end of last week.
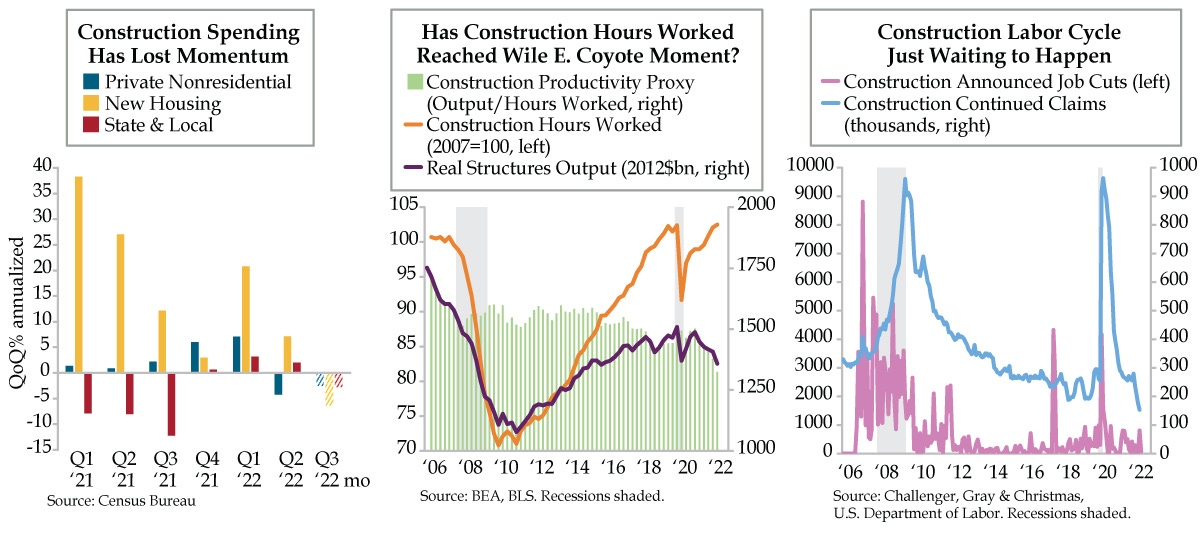
Believe it or not, these two fast-falling “positive” numbers reinforce a technical recession. Because so little data for the third quarter is in hand, as we did in Friday’s analysis of consumer spending data, today we illustrate the momentum for the summer quarter via the construction spending profile. In a nutshell, the top-line construction number disappointed 40 out of 41 economists in Bloomberg’s survey, with a -1.1% drop in June (versus the 0.1% consensus). A breakdown of the key source data used to construct business, housing and state & local investment is depicted in today’s left chart, which is where the process of counting beans kicks in.
Private nonresidential construction spending fell -0.5% month-over-month in June, marking the fourth consecutive monthly decline, the worst losing streak since the early days of COVID-19. New housing investment, covering single-family and multifamily construction, posted a -2.5% plunge, the largest since the pandemic’s outset. State & local construction was down -0.6% over the month following a -0.9% decrease in May. Most notably, momentum for all three GDP inputs is running below the waterline for the third quarter (that is, calculations of June versus the second-quarter average).
At the risk of ignoring the star of the macro show, the Census Bureau’s construction report plays second-fiddle to ISM’s manufacturing survey mainly because it’s old news -- it’s two months old vis-à-vis the ISM’s covering the just-closed prior month. In recession, however, construction rises in importance given its direct line into business, housing, and state & local investment
It follows that other construction indicators garner attention from a cycle perspective. Productivity is one of those residual economic measures. Construction productivity can be illustrated by contrasting the sector’s output with its labor input. Real structures GDP has quietly been in a decline for five straight quarters; it most recently stood -6.3% below year-ago levels in 2022’s second quarter (purple line). For a low-productivity sector like construction, which is labor intensive, the “boom” in construction hours worked (orange line) looks vulnerable.
In case you’re wondering, there are two explanations for the divergence between falling output and rising hours worked: 1) construction projects take time to complete, and with wage inflation driving job turnover, productivity declines; 2) construction labor data sourced from the payroll survey are exaggerating the strength and are vulnerable to a downward revision.
Whichever the reason turns out to be, we’re on high alert for construction layoffs given it’s in the crosshairs of the usual cyclical layoffs that occur when fundamentally driven recessions break. Excluding the COVID flash crash, the construction sector accounted for more than one-quarter of the drop in nonfarm payrolls on average in all the U.S. recessions since the mid-1970s.
If we could add an asterisk to today’s data, it’s that (not illustrated), the monthly decline in single-family residential construction clocked in at a -1.5 z-score. That bad boy is rare, as in the cow that’s still mooing.
Later this week, we’ll see both Challenger’s job cut report and that of nonfarm payrolls. To that end, neither has yet to flash a durable turn in construction. Layoff announcements remained contained through June (magenta line). Meanwhile, continued claims in the construction industry reached a cycle low in May (turquoise line). The compression in the volume of structures output going on for more than a year suggests both series could blink, especially since spending momentum across both private and public sectors is contracting at the start of the third quarter (red, yellow, and blue bars). Beans or no beans, even the ancient Greeks could glean what’s to come.

