


Crane Spotting
What weighs between fifteen and twenty pounds, stands close to six feet tall and has a wingspan of more than eight feet? If you majored in ornithology, then you easily answered the “Sarus crane,” the largest of its species found in parts of the Indian subcontinent, Australia, and Southeast Asia. Its coloration is unique among cranes because its red crown extends down a portion of the neck, the basis for its elongation. Aside from the red crown and upper neck, the Sarus crane sports large grey wings with black wingtips, a grey body, a grey ear patch of feathers within the red crown, and a greenish-gray bill. Despite a global population of only 15,000-20,000, the Sarus is considered sacred and not usually hunted by humans. Legend says that the poet Valmiki cursed a hunter for killing a Sarus crane and was then inspired to write the Hindu epic Ramayana.
Spotting cranes is a regular hobby for avian aficionados…as well as construction cycle chasers, of course. The RLB (Rider Levett Bucknall) Crane Index is a biannual publication that tracks the number of operating tower cranes in 14 major cities across the U.S. and Canada. Its fastidious tracking of the number of fixed cranes on construction sites provides a simplified measure of the current state of the construction industry’s workload in the first and third quarters of each year.
QI cited this gauge for years as evidence of the magnitude of the construction boom. That makes this abbreviated post-pandemic recap resonate all the more. No surprise, 2020’s third quarter saw a significant fall off in the number of cranes in operation, down 40 vis-à-vis 2020’s first quarter. The reopening impulse behind 2021’s burst saw a leap to the sky of 71 cranes, more than reversing the downdraft. Since last year’s opening quarter, there hasn’t been much net movement: 2021’s third quarter was down 22 cranes while 2022’s first quarter was up an equal 22. The latest quarter available, 2022’s third quarter was down 3 cranes. The stagnating pattern depicts a topping in a long construction cycle.
The timestamp for the latest RLB data was October 6th. Then, RLB said that “cranes are most present at residential and mixed-use projects, while contractors continue to face climbing material costs and workforce shortages.” The tempering of higher construction material costs will clearly arrive with a lag. To that end, at the close of 2021, the producer price index (PPI) for construction materials posted a record 35.1% annual increase, the steepest on record since series’ January 1947 inception. While that price shock didn’t wear off overnight, by October, this PPI reading was ten times smaller, at 3.5%; by November, it was 0.6% year-over-year (YoY). The next stop is deflation.
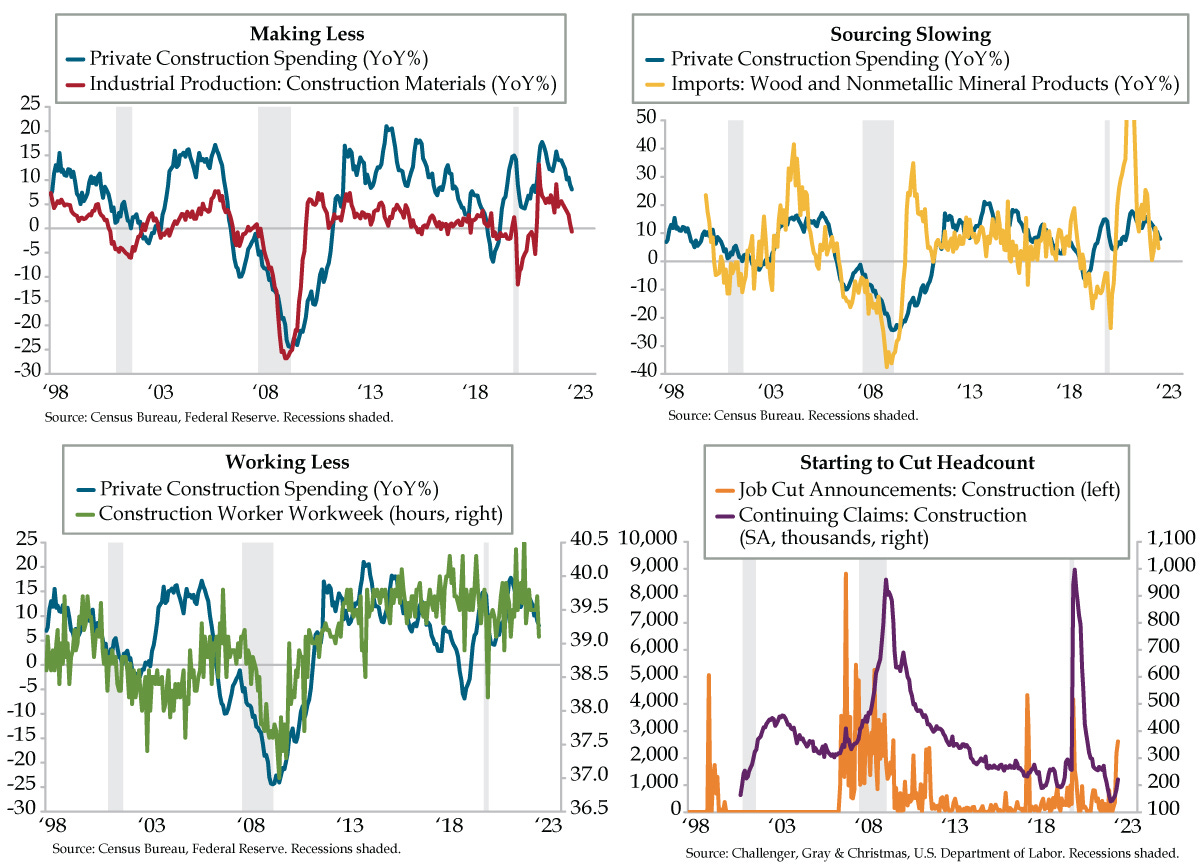
Demand validates this logical end. In November, U.S industrial output for construction materials registered the first YoY decline (-0.7%) in 21 months (red line). The critical context: The path for construction materials has historically tracked the private construction spending cycle, the combined measure of residential and nonresidential sectors (blue line). Upstream producers are making less, meaning downstream builders should be building less. This is a harbinger of things to come in 2023.
Construction materials aren’t just acquired from domestic industrial producers. Import prices of wood products and nonmetallic mineral products also dictate the construction cycle. Specifically followed are lumber (from wood) and cement (from nonmetallic minerals). Though volatile, these helpful guides have seen a significant downshift from May 2021’s blistering 105.1% YoY gain to December 2021’s 20.2%, which has since collapsed to October 2022’s 4.7% uptick (yellow line).
Construction is an inherently low-productivity industry. Last we checked, you need warm bodies to build homes and erect buildings; robots haven’t made a dent there (yet). Cycle chasers abide by the rule that construction relies on labor: cut hours first, then bodies. The construction workweek illustrates -- in November, it fell to 39.1 hours, the lowest since June 2021. While residential construction faces major headwinds, nonresidential construction projects are longer in duration. A broader slowing in the economy will ultimately govern hours across both private sectors.
The process of shedding labor in the construction industry is imperceptible if you limit your lens to capturing construction payrolls, which have expanded in 16 of the last 17 months. Broaden out to incorporate former construction workers now collecting jobless benefits, otherwise known as continuing claims and you see these ranks reached a seasonally adjusted cycle low in June at 140.8 thousand (low is good in this case). By November, this figure had risen to 220.7 thousand (purple line). The 20.1% five-month gain through November was the fifth largest on record; three of the top four occurred in past recessions.
Construction job cut announcements also have awakened. According to Challenger, Gray and Christmas, the jump in pink slip plans in October and November combined (4,789) was twice the pace of the prior 12 months ended September (2,445, orange line). The headcount reduction cycle is just getting started.
Tall, skinny birds aside, we’ve spotted the beginning of the end in the construction cycle. Labor is one of the most important inputs in this low-productivity area and cracks are emerging. Given the lagged nature of nonresidential construction to the leading residential area, tightening lending conditions for commercial real estate (CRE) along with the reduced demand for CRE loans mentioned by senior loan officers suggests further declines in construction payrolls.